Tool Playground Agent
The tool playground includes an AI agent that helps you debug and modify tools through natural language. Access it via the chat interface in the playground.Tool Input
The playground starts with a Tool Input card where you define the data your tool will process. We refer to this as the tool payload.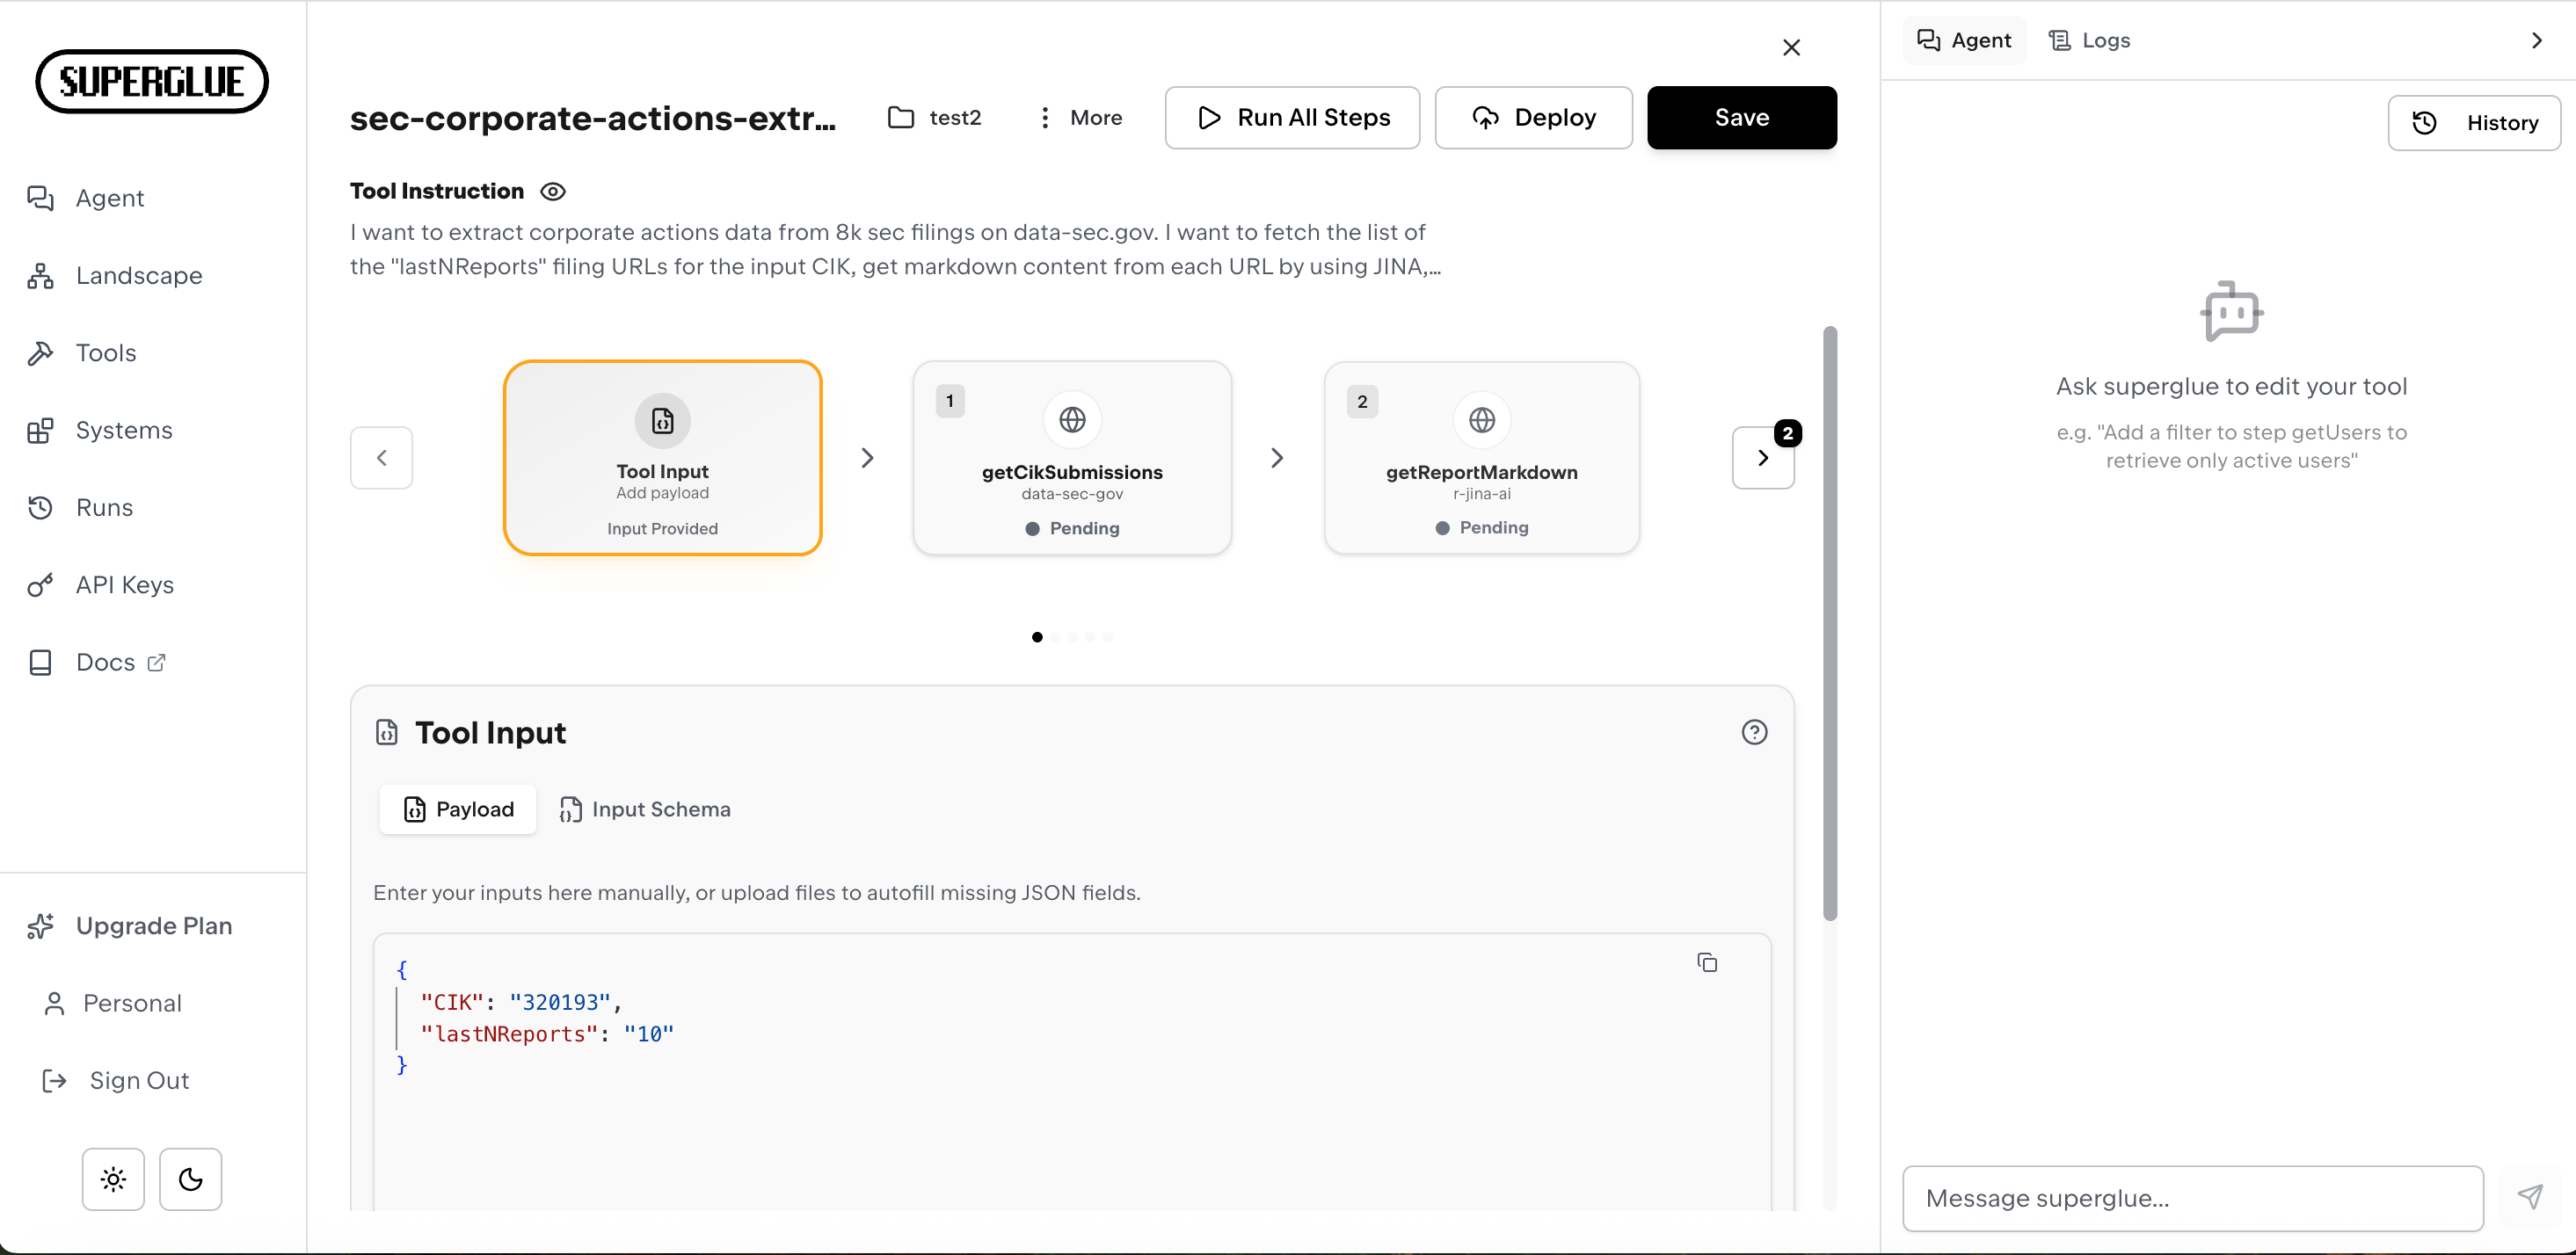
Manual JSON Input
Enter JSON directly in the payload editor. The playground validates your input against the input schema (if defined) and highlights any validation errors.File Upload
Upload files to use as input data. The playground:- Parses files automatically and adds them to your payload
- Shows file status (processing, ready, or error)
- Displays total file size
- Allows you to remove files
customers.csv, it becomes available in your payload and subsequent steps as the customers variable.
Schema Validation
The input card shows an amber-colored warning if your current payload doesn’t match the input schema. Click “Run Anyway” to proceed despite validation errors, or fix your payload to match the schema requirements.Run All Steps
Click Run All Steps to execute your entire tool from start to finish. The playground:- Executes steps sequentially
- Shows progress with a loading indicator on each step
- Marks completed steps with a green checkmark
- Marks failed steps with a red X
- Pauses before the next critical step and waits for your confirmation before continuing (for example, a step that writes data or makes changes in a third-party system)
- Navigates to the first failure or final output when done
Inspect a Step
Step Input
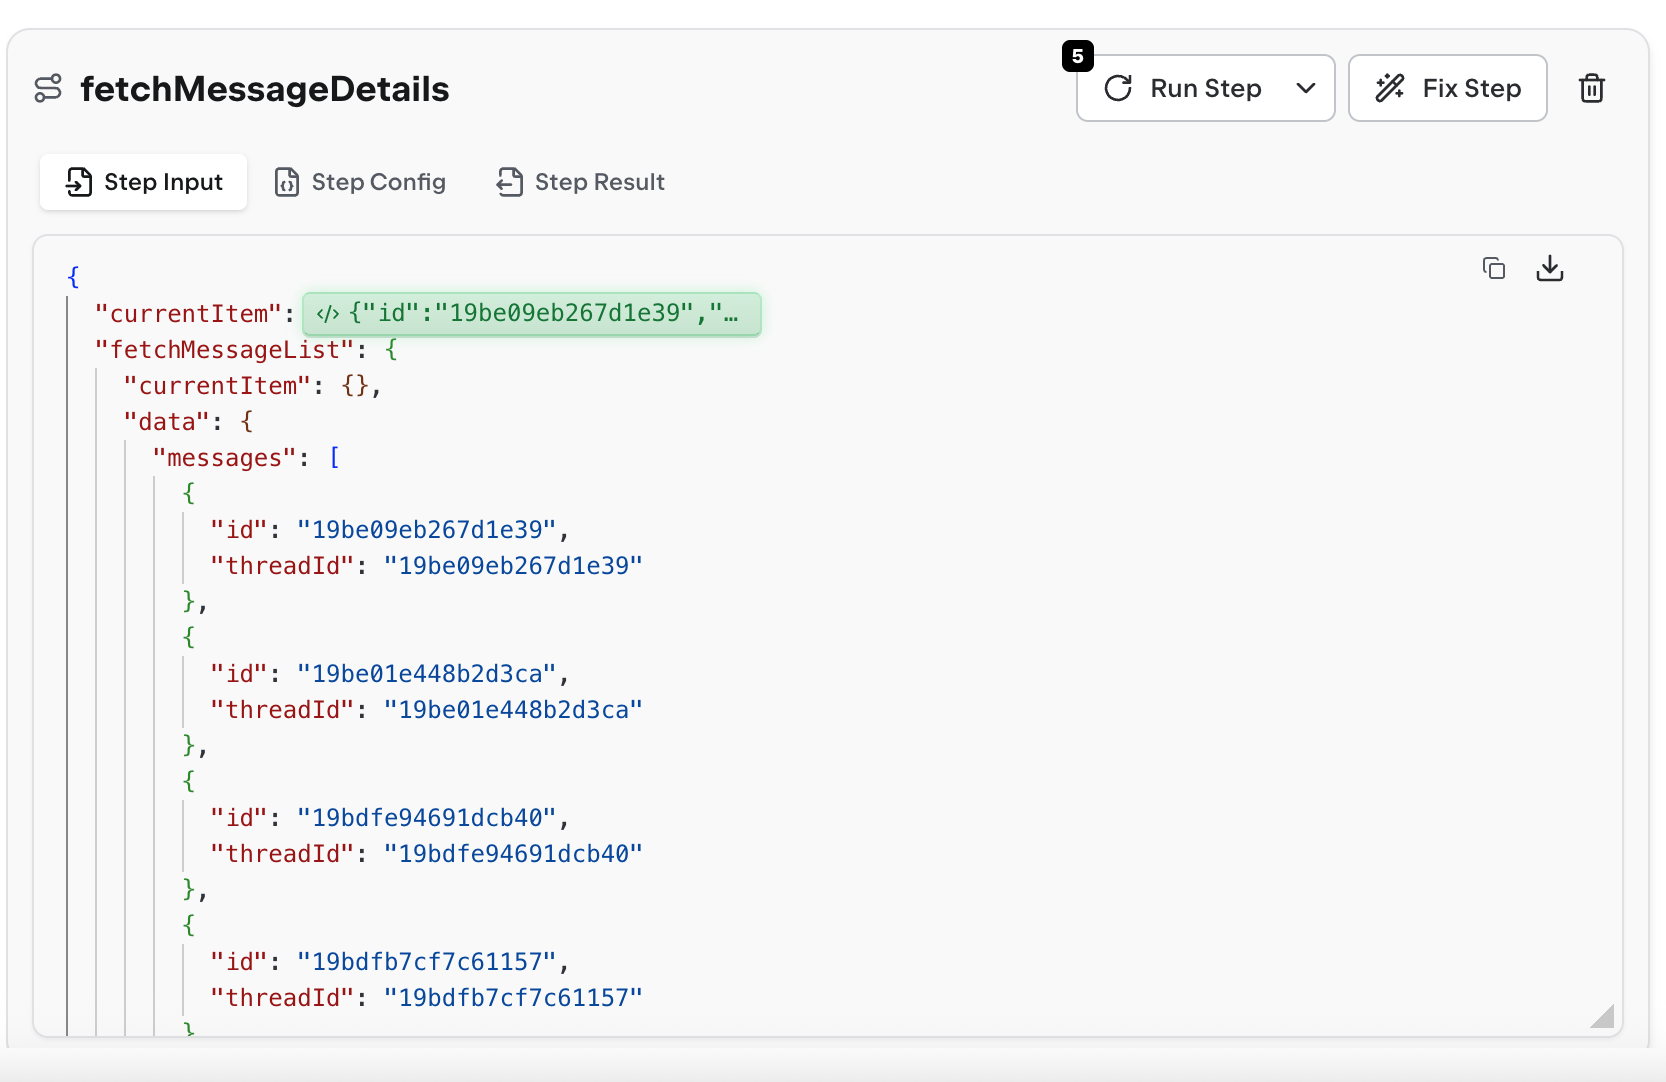
- currentItem: This is the evaluated result of the data selector showing as a template chip. See Using Template Expressions for more.
- Aggregated Step Data: All previous step results, payload objects and other input data.
Some data selectors may reference results from previous steps and may not be evaluated yet. Run all previous steps to inspect the evaluated data selector expression.
Step Config
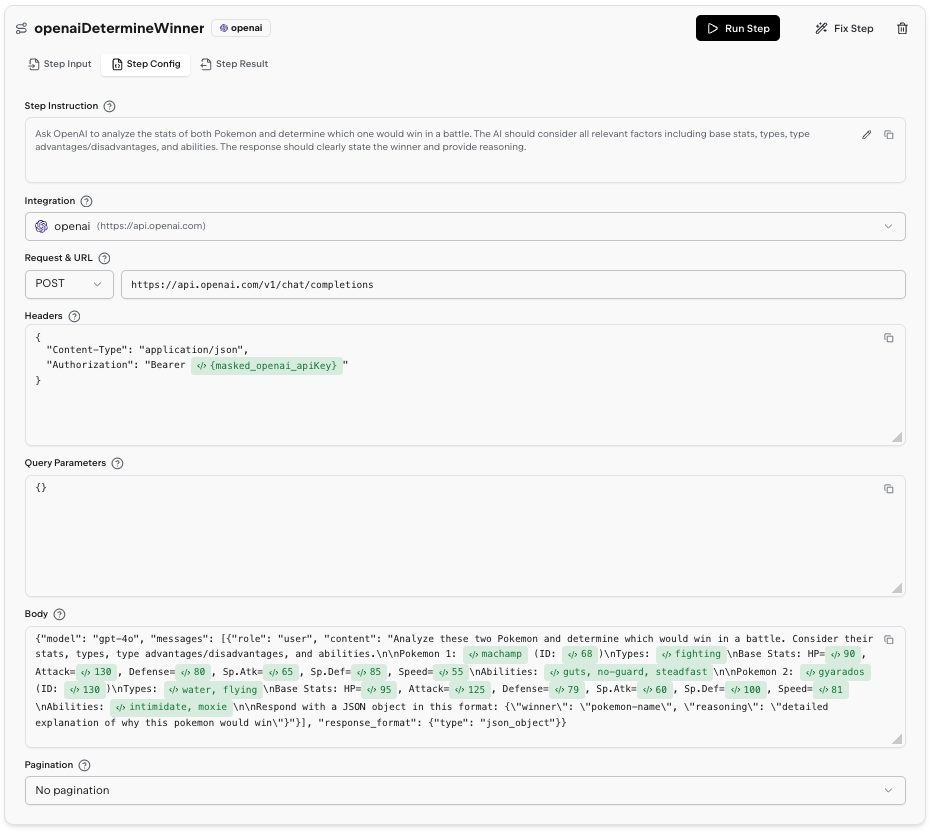
- Step Instruction – natural‑language description of what the step does and what the response should contain
- System – which system is used to make the call
- Safety badge – a
Step modifies data on systempill when the step performs write operations, so you can quickly spot calls that change external state - API Config – HTTP method and URL for the request
- Headers (JSON) – JSON object with the request headers sent to the server (for example, the
Authorizationheader) - Query Parameters – JSON object with the query parameters appended to the request URL
- Body – Request body content, which can be JSON, form data, plain text, or any format
- Pagination – controls how the step fetches multiple pages (strategy, page size, cursor/offset paths) or shows No pagination when pagination is disabled
- Stop Condition (JavaScript) – optional JavaScript function that inspects each
responseand pagination state to decide when to stop fetching more pages
Template Chips
Dynamic values in the config appear as template chips – small badges showing a preview of the evaluated expression. Click a chip to open its the templating popover, where you can edit the JavaScript expression and see a live preview of your code expression. Note that previews are only available if the previous step has completed successfully. To insert a new template, type@ anywhere in a text field to open the variable picker. Browse available variables by category (previous step results, credentials, loop context) and drill into nested properties. Selecting a variable inserts a chip with the correct accessor path.
Step Result
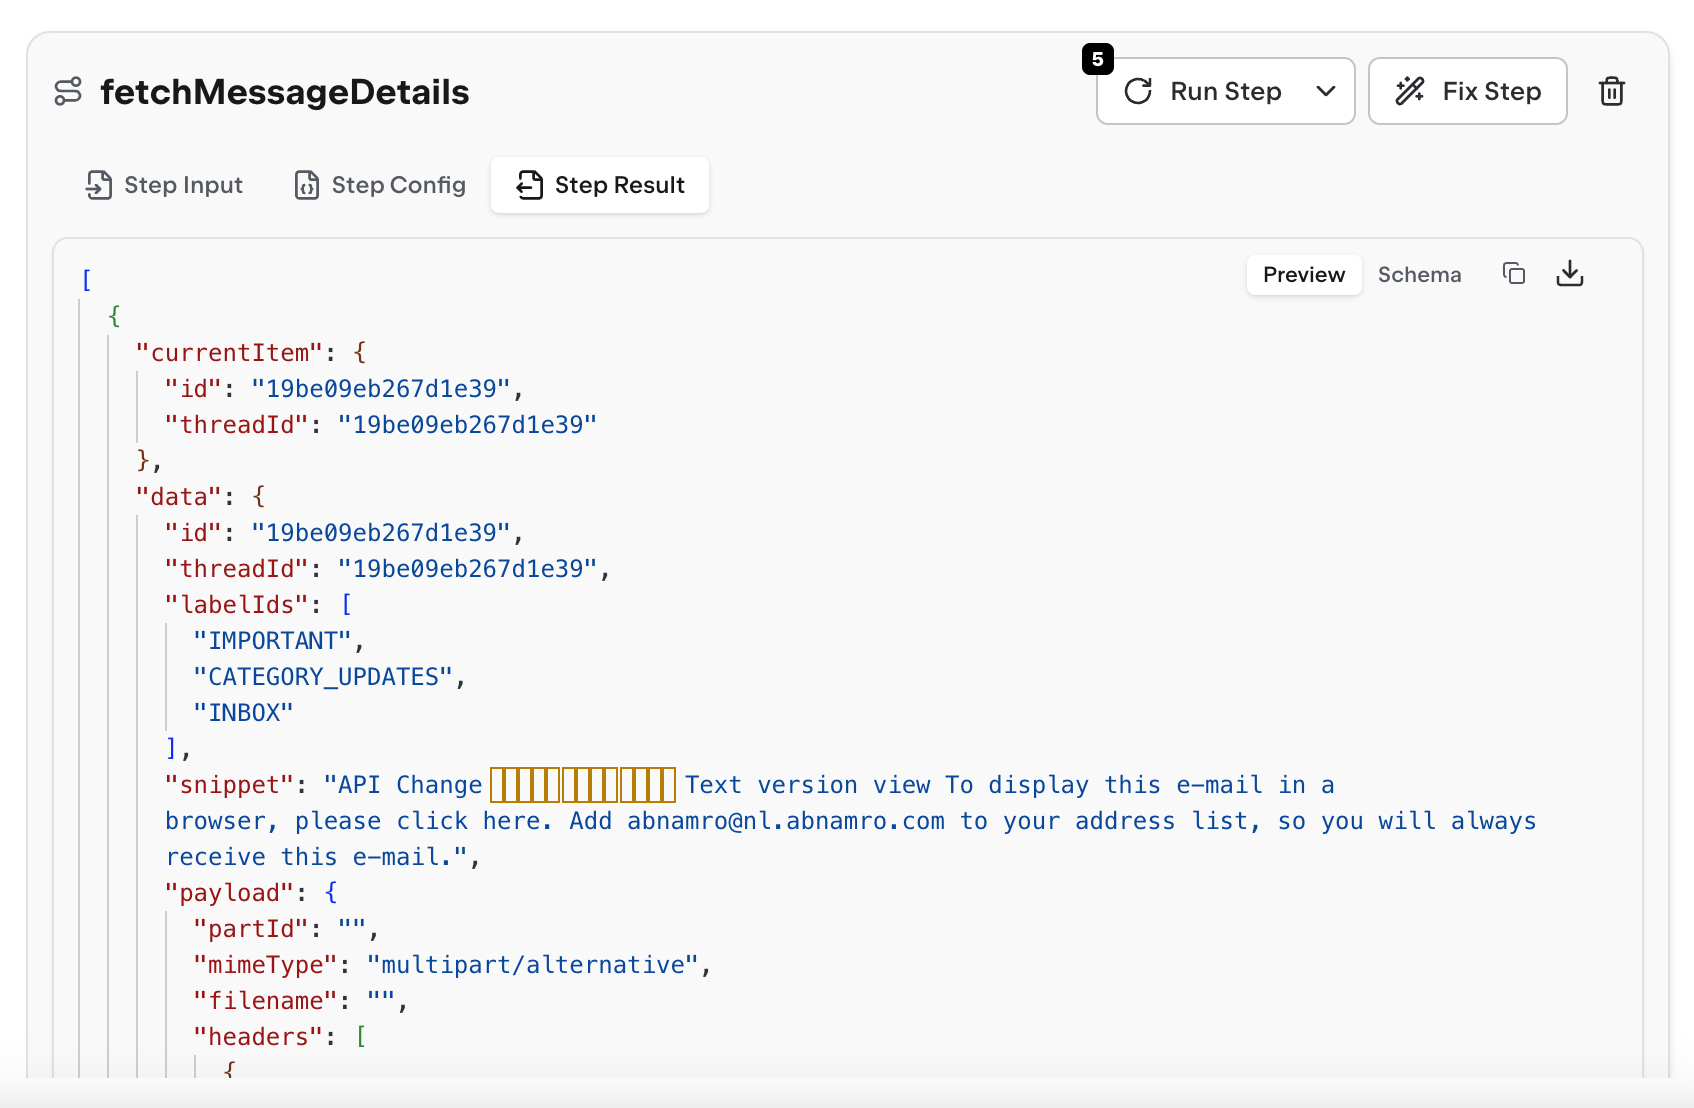
- Successful API responses
- Error messages (with full stack traces for debugging)
- Data structure returned by the step
Run Step
Executes just this one step using the current configuration and previous step results. Use this to:- Test changes to a single step without re-running the entire tool
- Debug a specific failure in isolation
- Verify your instruction changes work
Final Transform
The Final Transform card contains JavaScript code that shapes your raw step outputs into the final result structure.Edit Transform Code
The transform receivessourceData containing all step results:
Test Transform
Click Run Transform Code to execute your transform code against the current step results. This shows:- The final output structure
- Any JavaScript errors in your transform
- Whether the output matches your response schema (if defined)